Getting Started
Everything you need to go from zero to working with your data.
This guide is for anyone coming to ISLdata for the first time. It covers logging in, understanding the interface, getting your first data into the system, and seeing it in a view. By the end you'll have a clear picture of how the system is organized and be ready to explore the full User Guide.
What is ISLdata?
ISLdata is a collaborative data management platform for organisations working with complex, multi-stage processes and data that arrives from many sources. It connects data collection — via mobile survey apps, direct integrations, or manual entry — with organisation, cleaning, analysis, and reporting, all in one place and accessible to the right people at the right time.
It was built by Field Projects International, which runs large-scale biological sampling programs — hundreds of specimens collected each day, across multiple simultaneous teams, with a separate laboratory team picking up the thread when samples arrive for analysis. Projects span multiple years, involve contributors at different levels of access, and require traceability from the moment something is collected through every downstream step. FPI had tried Excel, Access, SharePoint, PostgreSQL, FileMaker, and Knack over the years. Each solved part of the problem but broke down somewhere else: when data needed to flow between stages, when teams needed live visibility without stepping on each other's work, or when the audit trail mattered. ISLdata was built to hold all of that together — not just for biology fieldwork, but for any organisation managing interconnected data, parallel teams, and processes that move records through stages.
The system is organised around four core objects. Understanding these will orient you to everything else:
All of this lives within a workspace — an isolated environment containing your sources, views, users, and audit trail. You'll be invited to a workspace by an administrator. If you need access to a different workspace, contact your admin.
Logging In
ISLdata uses passwordless authentication. There is no password to create or remember — your email inbox is your key.
-
Enter your email address Navigate to your ISLdata instance and type your email address into the login field. Your administrator will have told you the URL.
-
Check your inbox You'll receive an email with a secure login link almost immediately. If it doesn't appear within a minute, check your spam or junk folder.
-
Click the link The link is single-use and expires after a few minutes. Click it and you'll be logged in directly — no password prompt.
The login email comes from your organisation's configured mail sender. If you're not sure what address to expect it from, ask your administrator. If a link expires before you click it, simply go back to the login page and request a new one.
Your Workspace
After logging in you'll land in your workspace. A workspace is a completely isolated environment — its own database, its own set of users, its own audit trail. Your data does not mix with any other organisation's workspace.
What you can see and do within the workspace depends on the permissions your administrator has assigned to you. You'll only see sources, views, dashboards, and reports that you've been given access to. If something is missing that you expect to see, contact your administrator.
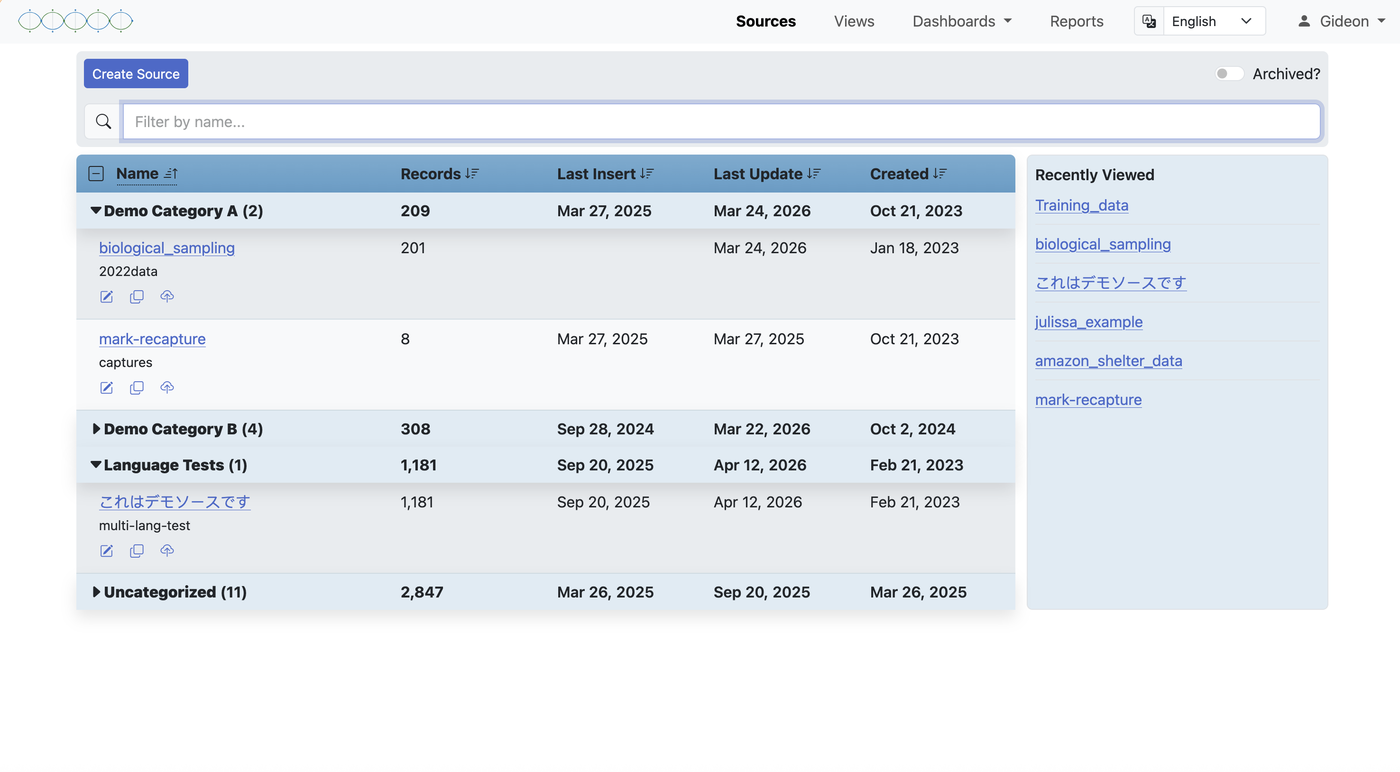
The Interface
The main screen is the Data Viewer. The left sidebar lists all the objects you have access to, grouped into Sources, Views, Dashboards, and Reports. Clicking any item opens it in the main content area as a data table, chart page, or document.
At the top of each panel is a search bar — type any name to find a source, view, report, or dashboard quickly without scrolling. Objects can also be organised into categories, which appear as collapsible groups in the panel to reduce clutter as your workspace grows.
Getting Data In
Data enters ISLdata through a source. There are three ways a source can exist in your workspace:
1. Automatic sync from a connected service
If your workspace is connected to ODK Central or ESRI Survey123, sources appear automatically as soon as submissions arrive. Each form becomes its own source — no setup needed on your end.
2. Importing a spreadsheet
If you have data in a CSV or Excel file, you can create a source and import it. The column headers in your file define the fields, and the rows become records. This is the most common way to bring in lab results, reference tables, or any dataset not collected through a mobile form.
- Create a new source
Navigate to Sources in the sidebar and click New Source. Give it a name. - Upload your file
Start the import wizard. Upload your CSV or Excel file — ISLdata will preview the columns and rows. - Review the staging area
Before anything is committed, your data lands in a staging area. Check it looks right. - Commit
Confirm the import. Records are now in the source and the import is logged in the audit trail.
3. Manual entry
You can add records one at a time through a data entry form — useful for logging individual events, test results, or observations as they occur, without a spreadsheet in hand.
Creating a View
Once you have a source with data, try creating a view. A view is a non-destructive window into the data — you can choose which fields to show, rename them, reorder them, and set default filters, without changing anything in the source.
- Go to Views and click New View
Select your source when prompted. - Select your fields
Choose which source fields to include. Untick anything that's not useful for this view — internal IDs, metadata fields, and so on. - Rename fields if needed
Give fields more readable labels. The source names are preserved underneath — this is display only. - Save and open the view
The view appears in your Views list and will always reflect the latest source data.
Views are also where you combine data across sources (by stacking or merging), add fields that exist only in the view, and build curated working datasets for specific analyses or team members. See the Views section of the User Guide for the full picture.
Exporting Results
When your data is organised the way you want it, export it. From any source or view, use the export option to download the current data as a CSV or Excel (XLSX) file. The export reflects whatever filters are active and whatever columns are visible — what you see is what you get.
Next Steps
You now have the essentials. For everything beyond the basics, the User Guide covers every feature in depth — sources, views, inline editing, copy-to pipelines, dashboards, reports, plots, permissions, and more.
| I want to… | Go to |
|---|---|
| Understand all source features | User Guide → Sources |
| Combine data from multiple sources | User Guide → Combining Sources |
| Move records through a pipeline | User Guide → Copy-To |
| Build a dashboard | User Guide → Dashboards |
| Create a plot with R | User Guide → Plots & Visualizations |
| Understand permissions | User Guide → Permissions & Sharing |